ShaderGraph Extensions: Debug Value
ShaderGraph Extensions: Debug Value is a standalone plugin that adds learning and debugging features to ShaderGraph.
Debug Value
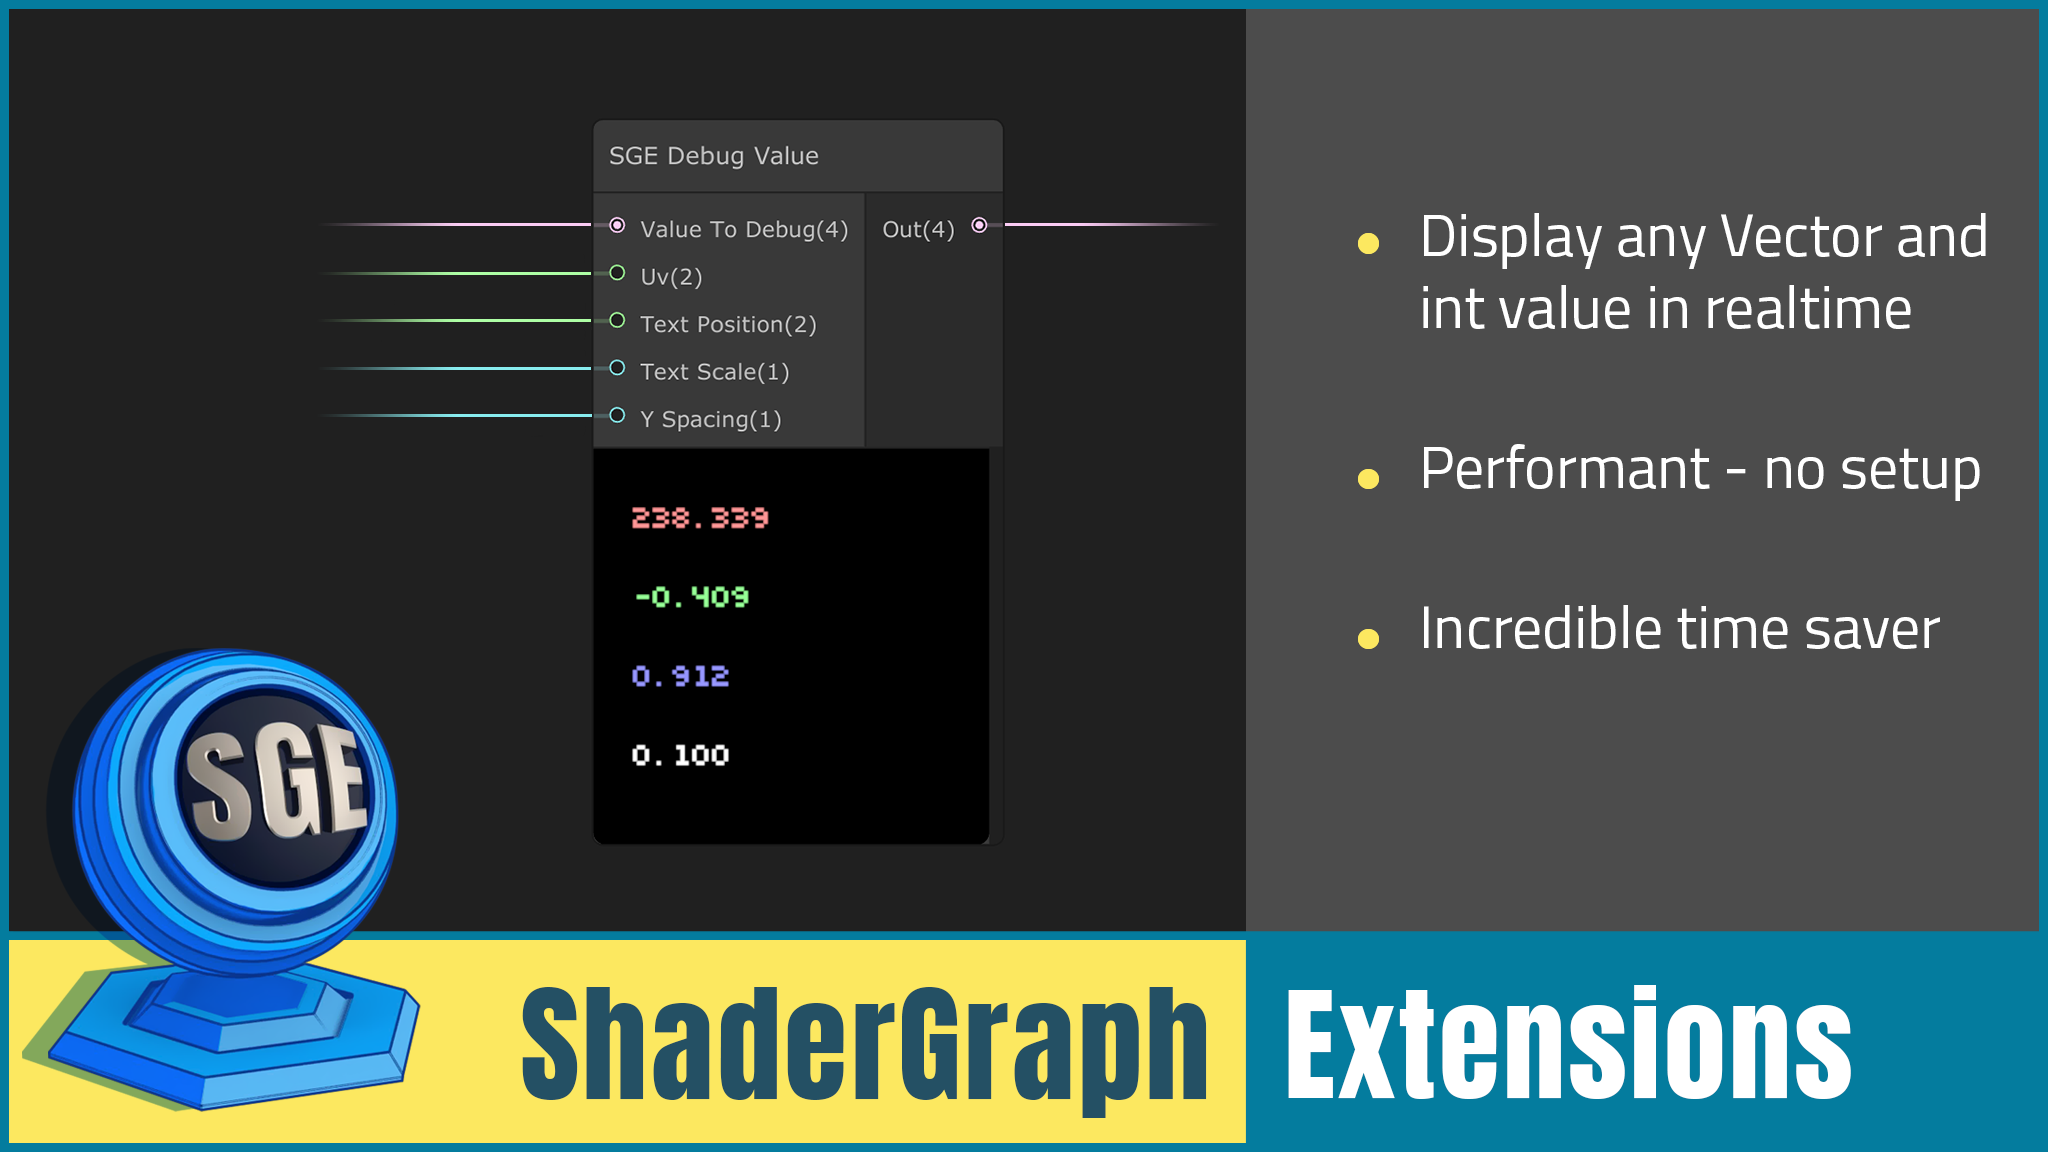
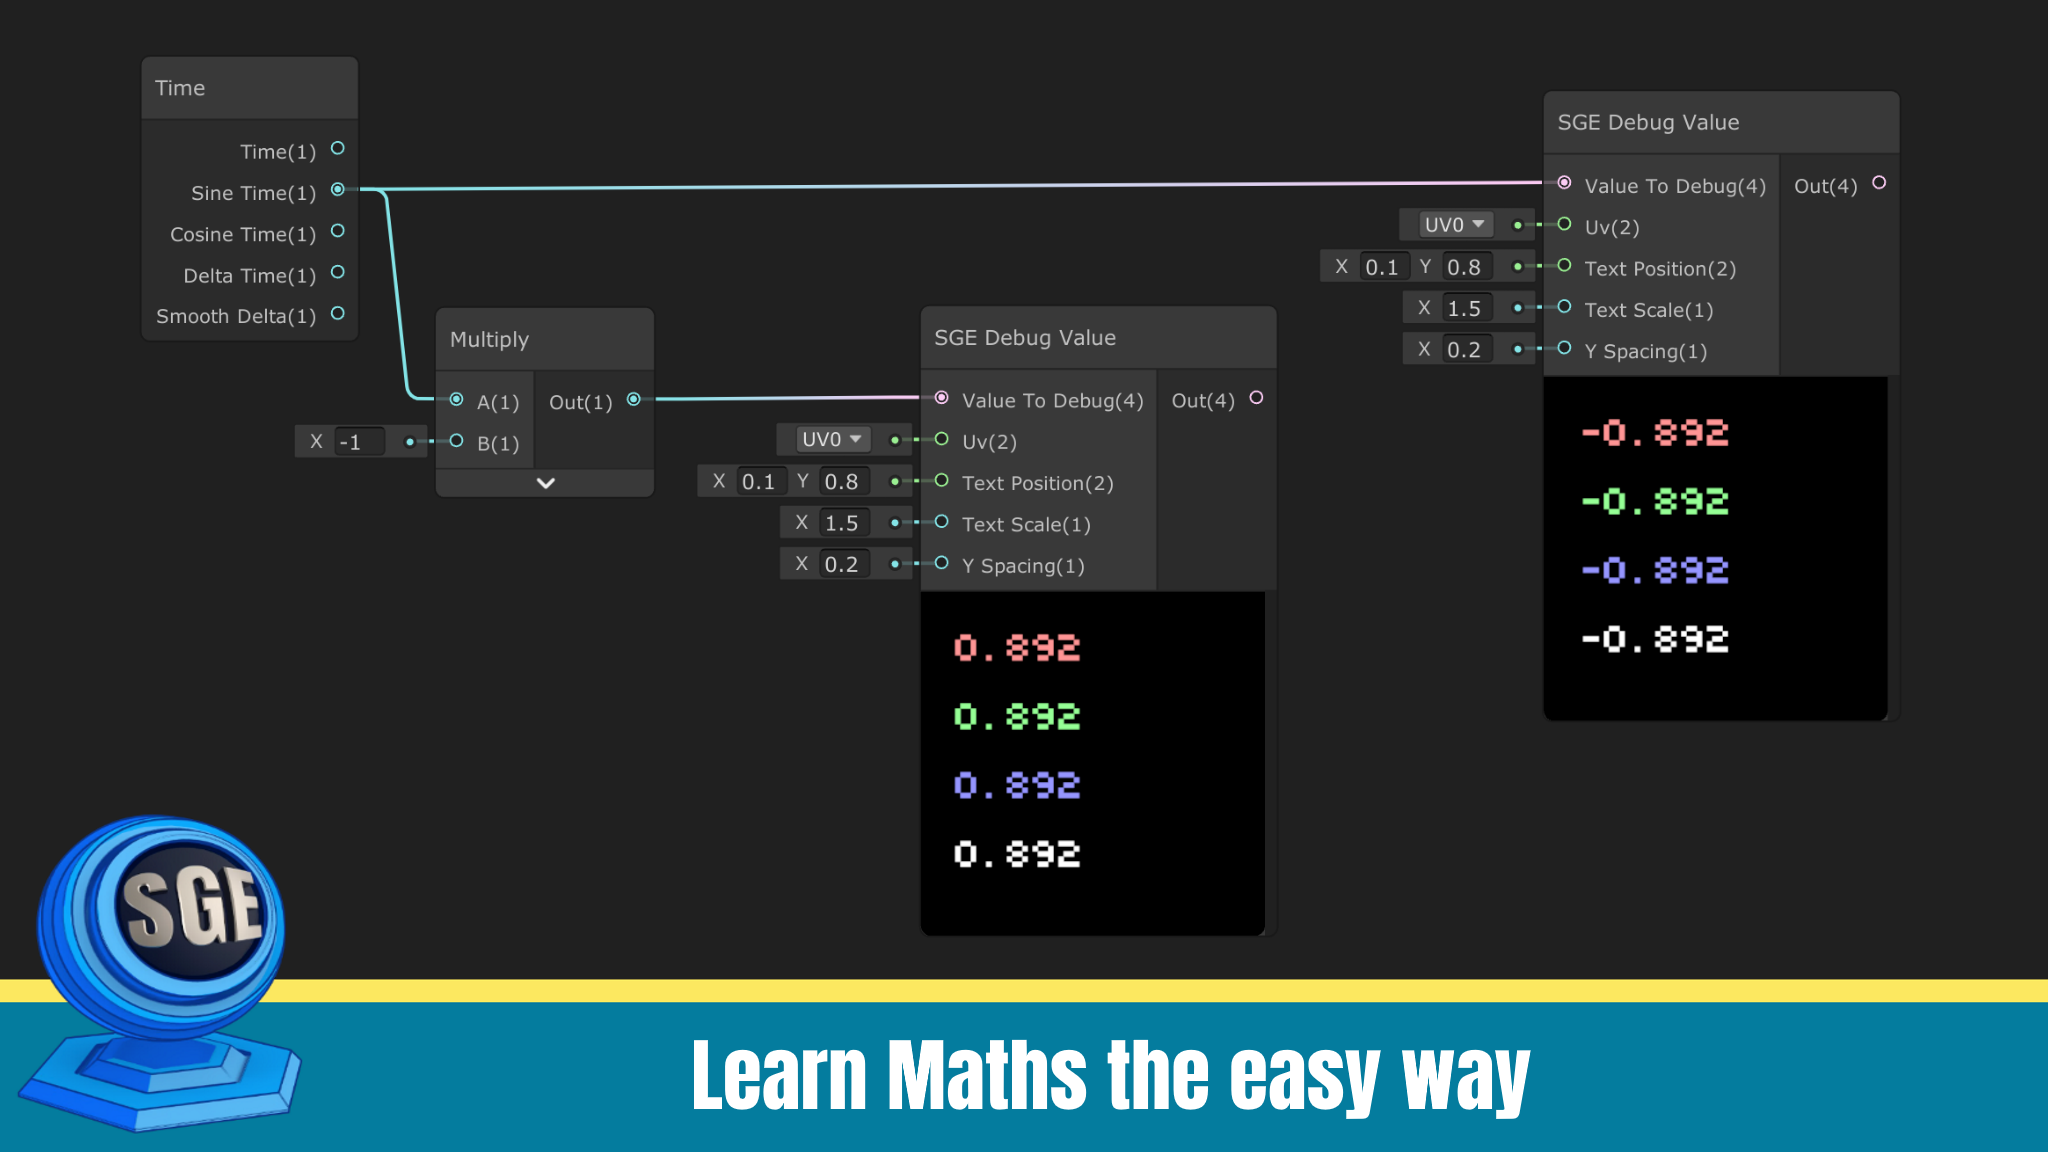
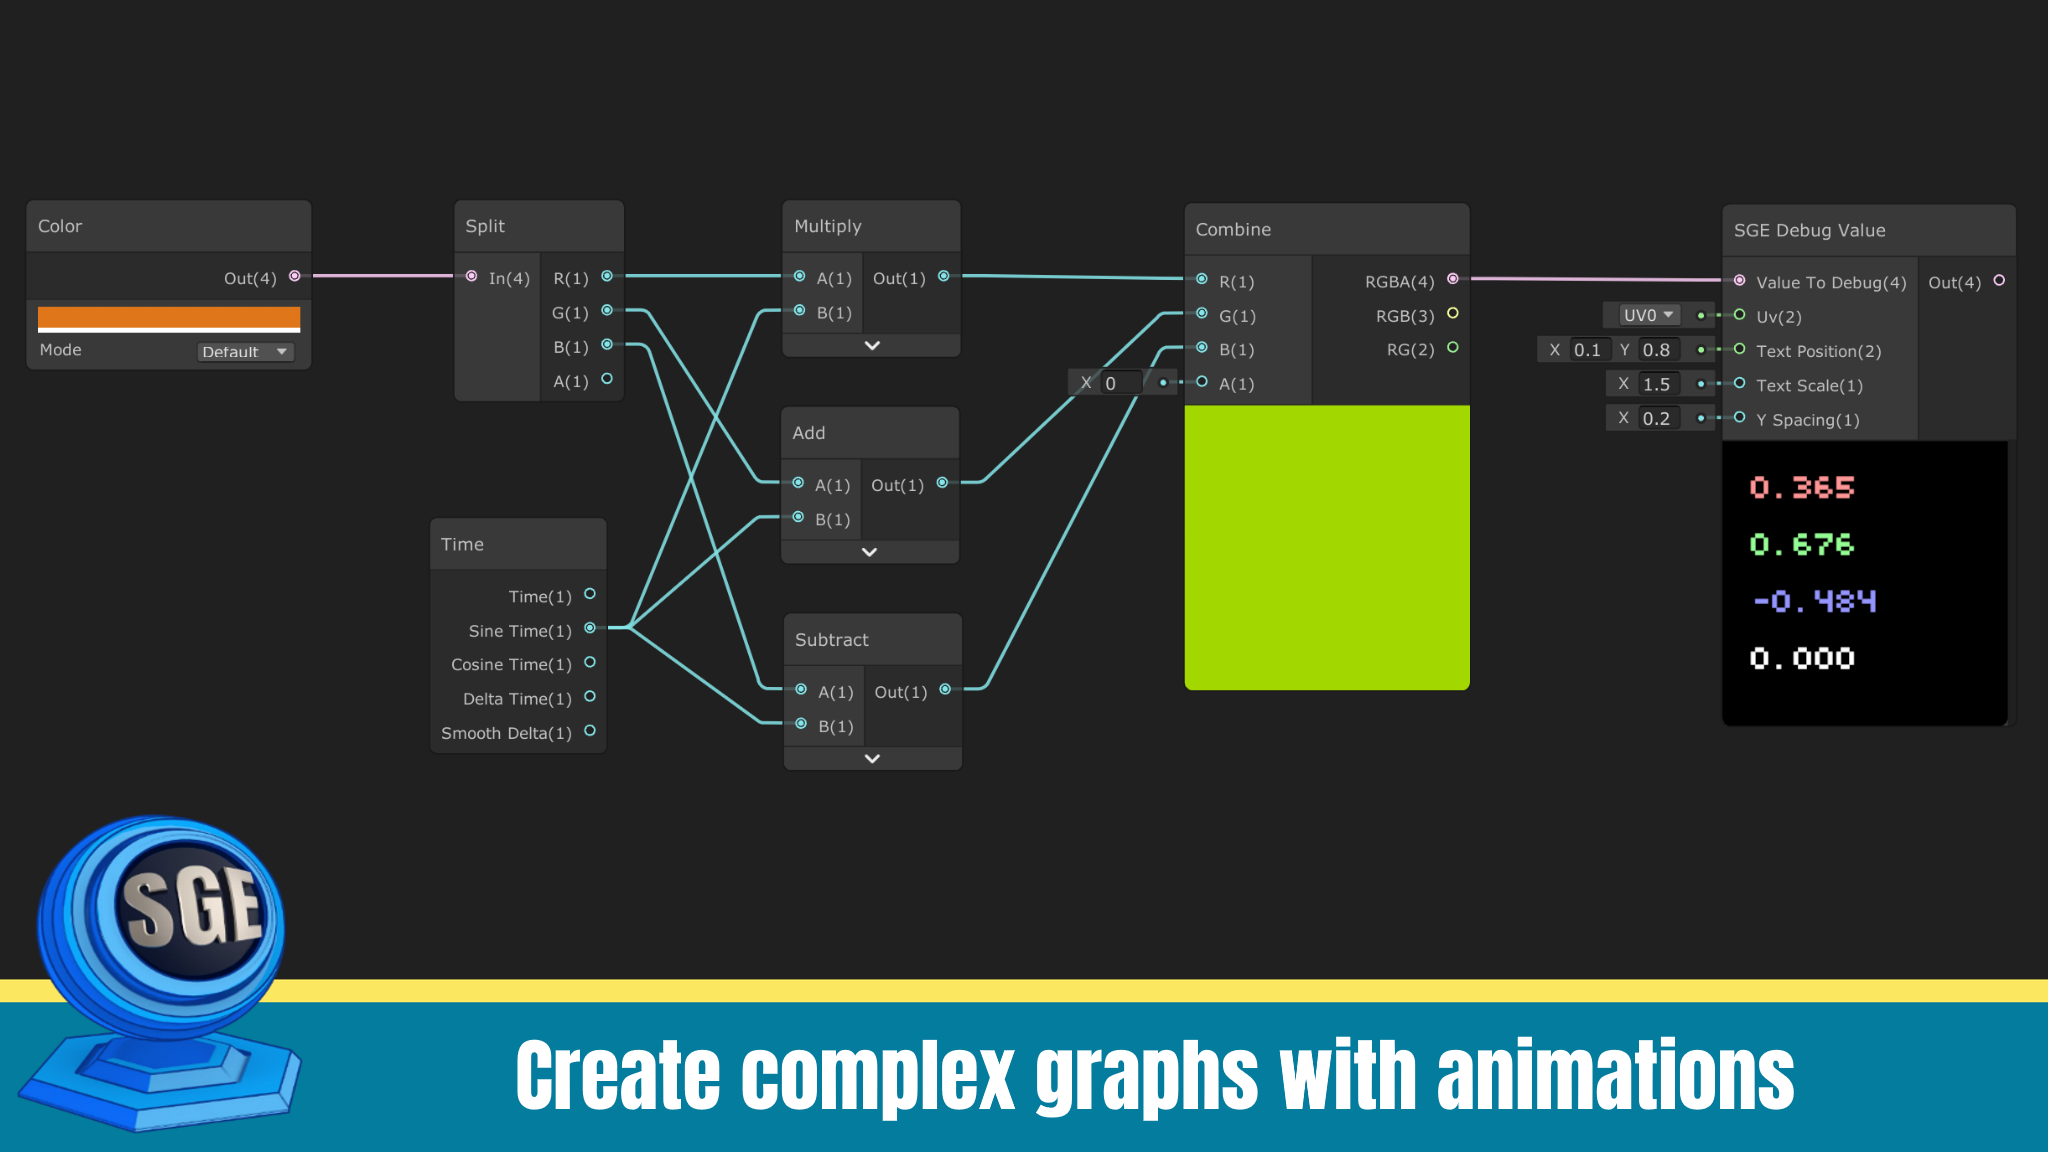
Debug Value is a custom node that display a shader's pixel value as text on screen. It can help you debug and understand why a specific effect or shader graph might not be working, and is available right there when you need it.


How to use it
Because Debug Value is a custom node, you can add it to your graph like any other node! It is available at your fingertips and can display a various array of types:
- Vector1
- Vector2
- Vector3
- Vector4
- int
Parameters
| Name | Type | Description |
|---|---|---|
| Value To Debug | Various (see above) | Input value that should be displayed on the node's preview area. |
| Uv | Vector2 | Default to uv0 and should be left as is. It's where the text will be displayed. |
| Text Position | Vector2 | Where the 1st component will be displayed. (0,0) is bottom left, (1,1) being top right. |
| Text Scale | Vector1 | Arbitrary text scale. Can be more than 1, but should be greater than 0. |
| Y Spacing | Vector1 | Vertical spacing between a vector's component. You might need to adjust it along with the text scale. |
Performances
If you don't link the Debug Value node to your master node, it becomes free (that's how ShaderGraph itself works). It means you can leave your debug informations where you need it until you come back later, without fear of affecting performances!
Requirements
- Unity 2019.2, 2019.3, 2019.4, 2020.x, 2021.1 or 2021.2
- support not guaranteed for preview, beta or alpha package
- ShaderGraph Extensions: Debug Value requires one license per seat